

July 22, 2024
Each year, CWSAA and its members gather performance data that defines the narrative of Western Canada’s ski industry. Key metrics include skier visits, tax contributions, direct and indirect employment, economic impact, and export revenue, reflecting incremental spending in a jurisdiction. These figures paint a picture of the ski industry’s economic significance and its impact on western communities and provinces and territories. This data is essential in demonstrating the value and scope of the ski industry to governments. The primary industry reports are as follows:
- Skier Visits: A consolidated report of annual CWSAA skier visits.
- Value of Ski Areas Economic Impact Study: A direct and indirect measure of the economic impact and contribution of ski areas.
- Financial Analysis: Detailed metrics of ski area business units for internal benchmarking.
- Canadian Ski Council Reports & Research: National studies reporting on consolidated metrics and research from across Canada.
The timing of these reports is influenced by seasonal cycles, ski area fiscal year-ends, and data analysis periods. Skier visit data is gathered at the end of each ski season. Ski area financial data is collected between spring and fall based on ski area year-ends and reported to the study participants in December. This collective financial data forms the foundation of broader economic impact reports, which are finalized in the new year but pertain to the previous winter season. For example, the economic impact below reports on the 2022/23 ski season.
2023/24 Skier Visitation (most recent season)
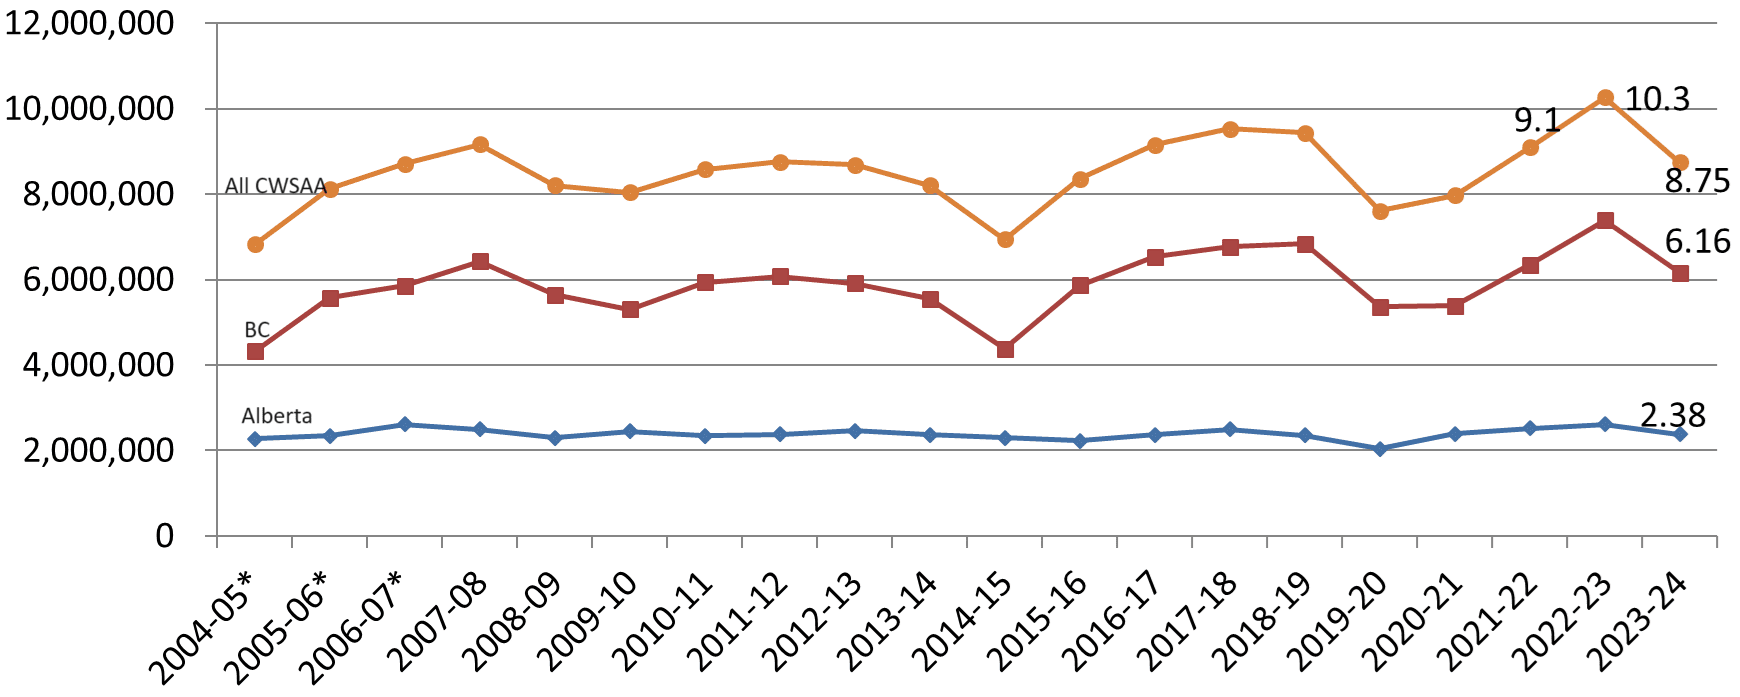 Skier visits are compiled at the end of each winter season. The 2023/24 ski season saw varied skier visit trends across different geographic regions, and ski areas worked tirelessly to start the season amid challenging weather conditions. Long-haul destination visits, particularly from the USA, performed strongly. Regional drive markets were robust in some areas but softened in others. Local passholder visits depended largely on local conditions.
Overall, skier visits in Western Canada for 2023/24 reached 8.75 million, 15% below last season’s record high of 10.3 million, ranking in the top 8 of the past 20 years. This indicates a strong and confident industry, especially considering the significant capital investments being made across the industry this summer.
Skier visits do not necessarily reflect revenue and financial experience, but they are one of the primary indicators of industry performance. Origin of guest and per capita spend significantly impact the revenues of ski areas and partner businesses within a destination eco-system such as restaurants, accommodators and ancillary activities.
 Value of Ski Areas Economic Impact: 2022/23 Report (2 seasons ago) add updated 1 pg graphic
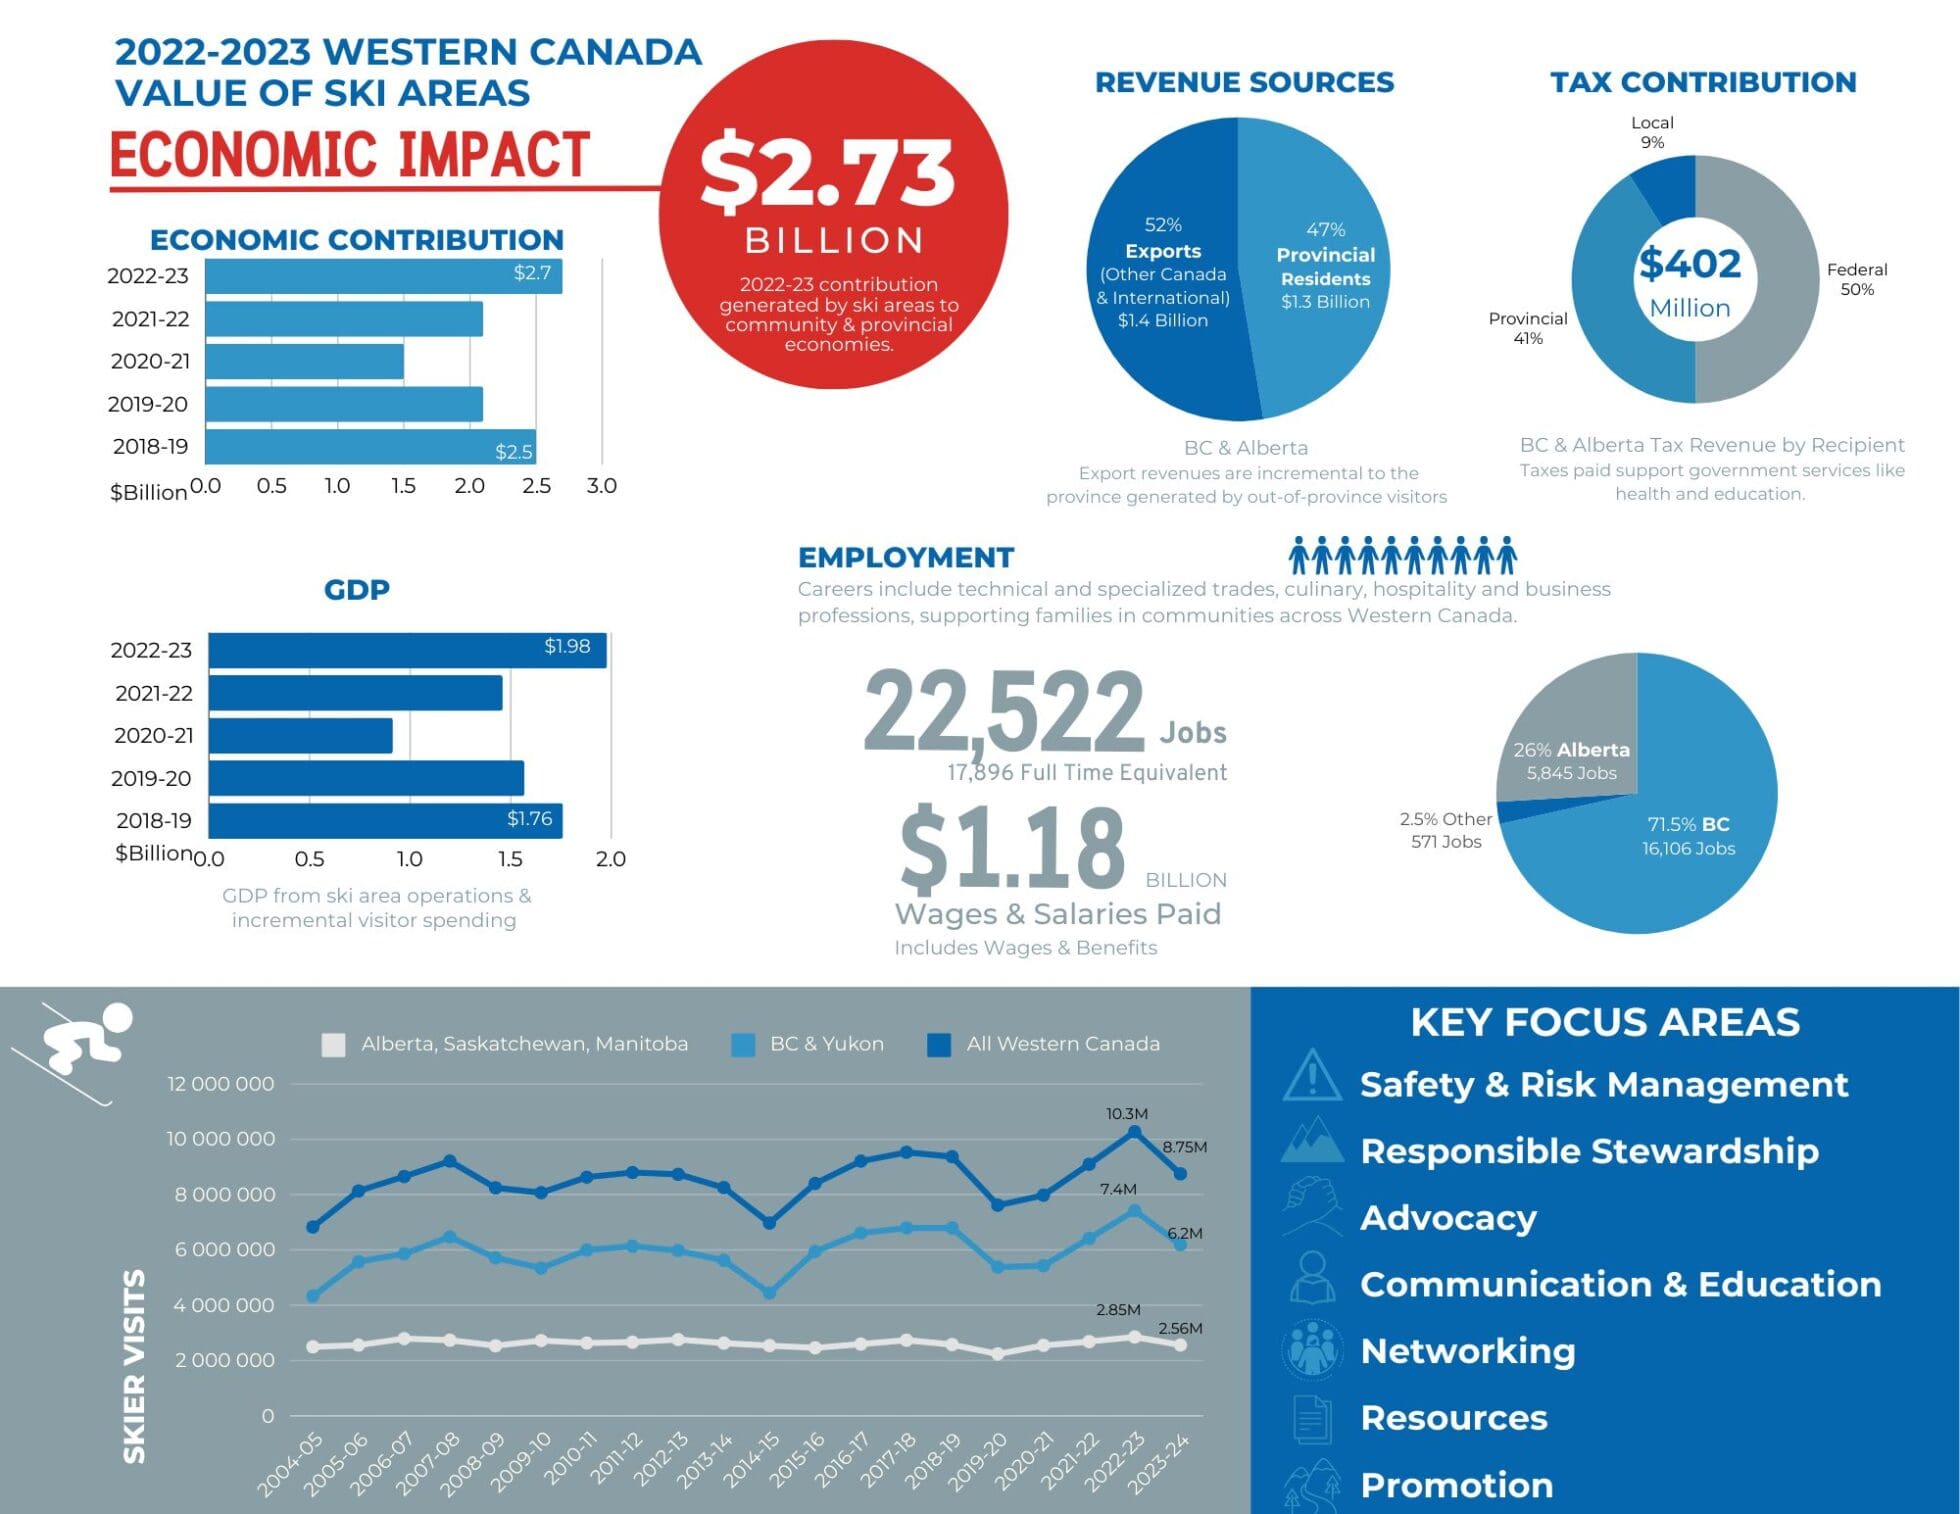
The 2022/23 season showed substantial growth in economic contributions compared to 2021/22 and also exceeded pre-pandemic levels. 2022/23 was a good season in terms of snowfall and skier visits for many operators. As such, BC and Alberta saw substantial gains over 2021/22 and represents the first season without significant pandemic related restrictions. Alberta saw a recovery in 2021/22 while BC took slightly longer due to higher reliance on international markets.
Below are some key highlights from the study.
- $2.73 billion (2022/23) was generated by ski for local and provincial economies across Western Canada
- This represents a 32% increase from 2021/22 season and 9% over the 2018/19 (pre-pandemic) revenues.
- BC ski areas generate $2.15 billion and Alberta ski areas generate $505 million in Economic Impact
- 22,522 jobs were generated in western Canada in 2022/23
- Jobs increased 20% from the 2021/22 season; and remain 17% lower than pre-pandemic employment.
- While BC jobs have increased by 27% over 2021/22, they remain 24% below the pre-pandemic job rate. Meanwhile in Alberta, jobs have exceed the pre-pandemic levels by 8%.
- $1.98 Billion in GDP from ski area operations and incremental visitor spending was generated in 2022/23. This represents a 35% increase over 2021/22 and a 12% increase over 2018/19 (pre-pandemic)
CWSAA Financial Analysis
Each year CWSAA’s friends at Ecosign Mountain Resort Planners Ltd. prepare the CWSAA Ski Industry Financial Analysis which is based on submissions by ski areas. It provides operators valuable benchmarking by business unit and is only available to participating ski areas. There is no cost to ski areas and each are encouraged to participate and may contact CWSAA for more information.
The collective Financial Analysis data is put through recognized input / output models by Align Consulting to create the “Value of Ski Areas in Western Canada” report (highlights noted above). This presents the full size and impact of the ski industry in Western Canada.
Canadian Ski Council 2022-23 Industry Data (2 seasons ago)
Results from the National Consumer Satisfaction and Profile Study and The Canadian Model for Growth.
The Canadian Ski Council (CSC) annual research study continues to show extremely strong interest for snow sports and some potential positive impacts that the pandemic may have on future participation. These insights are derived from the research conducted by the CSC via participation in national programs.
Some of the highlights of the research include:
- The 2022/23 season saw a record high of 21.1 million skier visits. Up 5.6% from 18.9 million year over year. BC and Quebec continue to own the largest share of the national visit total at 35% and 31% respectively. From the perspective of the domestic and international markets, the domestic skier visits grew by 1.9% while the international visit market continued its rebound from the COVID 19 Pandemic and grew by 57%. Despite this growth, international visits are still 18% behind pre-pandemic levels. Readers note, The CSC expects a moderate decline in active skiers and riders during the 2023/24 mainly due to weather related factors. Season 2023/24 results will be available in September 2024.
- 8 million Canadians are active snow sports participated (estimated as of winter 22/23). Up from 2.7 million participants in the last full year, which accounts for 7.2% of the population. Readers note, The CSC conducted a restatement of the national active participants in the 2023/24 season because of improved data collection. All previous season data has been adjusted to align with the changes.
- Participation in Canada has grown in two of the three market segments that the CSC tracks as part of the Canadian Model for Growth.
-
- The beginner segment now accounts for 600,000 participants (+100,000) and the Core skier now accounts for 1.2 million active skiers/riders (+50,000).
- Overall, skier days is expected to remain at 5.9 per domestic skier on average.
Strong appreciation and intention to continue skiing/snowboarding and recommend it. 100% enjoy skiing/snowboarding. 97% are likely to continue. Net promoter score = 65% up from 64% in 21/22. By comparison, scores for western Canada are the same, save for the Net Promoter Score which tallied 61% in 22/23.
The CSC will be unveiling deeper data and insights to active program members in a series of Zoom calls over the coming months. Drop an email to programsupport@skicanada.org to make sure you are on the invitation list.
This information is critical to qualifying our industry for government through recognized metrics, and presenting our industry as an important economic generator and contributor to the social fabric of Canada. The data is vital in supporting every request of government.
For more information on these studies, please contact CWSAA directly. For information on the Canadian Ski Council’s research studies, please contact the Canadian Ski Council.